“Factor-based investing” is a hot topic, but it’s a clunky misnomer. The dean of value investing, Benjamin Graham, says:
An investment operation is one which, upon thorough analysis, promises safety of principal and a satisfactory return.
- Security Analysis, 1934
Factor-based investing sure isn’t that. It’s a form of asset allocation, not investing. Investing means evaluating the nature of a business and determining that it can produce a good return on your money; allocation means selecting from a menu of lumps of securities, each of which have certain average returns and standard deviations. Note that while asset allocation and traditional investing aren’t the same thing, they’re hardly opposed: asset allocation works to the extent that markets are efficient, and traditional investing is a vast ongoing effort to make markets efficient by buying what’s cheap and selling what’s dear. That sort of operation is easier to pull off when the counterparty to your trade is valuation-insensitive — an asset allocator, for example.
The key insight of asset allocation is that you can find clusters of securities — stocks, corporate bonds, municipal bonds, etc. — such that their average returns and standard deviations are individually pretty similar, but their correlations to one another are low enough that their collective standard deviation is lower than that of the individual securities. Instead of buying one stock, you can buy a basket of stocks and realize the same expected return with lower volatility.
Canny statisticians have identified further spins on this, and that’s where factor-based investing comes in. Originally, we had the Capital Asset Pricing Model: an asset’s expected return is the sum of the risk-free rate, and a risk premium multiplied by some constant representing the riskiness of the asset. In other words, if treasuries return about 2%, stocks return 6% more than that, and this particular stock is half again as risky as average, then its expected return is 2% + (1.5 x 6%), or 11%.
A fairly boring implication of this is that a portfolio of risky stocks plus cash can equal the return (with the same volatility) as a portfolio of normal stocks. A more interesting approach is, instead of just looking at one factor (market risk), we can decompose returns into several factors, each of which has its own risk and reward. Popular factors include valuation (often expressed as price to book value or price to sales), size (market capitalization), momentum (the stock’s recent performance relative to the market), quality (high and stable profit margins and returns on investment), etc. Mathematically, any model that incorporates more features has a higher correlation to reality than a model with fewer — if your model includes a “does it rhyme with -itcoin” factor, it’s going to make some sweet predictions in the 2012–2017 timeframe. But these factors do better than random chance would suggest. As far as we can tell, they really do tell us something fundamental about which assets the market will pay you extra to earn.
You can tell a good story about some of these aberrations: value investing is just reasoned contrarianism. Lazy, short-sighted speculators are dumping sound companies after just one bad quarter! Momentum investing is a little less virtuous-sounding: insufficiently lazy and short-sighted investors are failing to extrapolate from one quarter! But momentum is, arguably, a logical signal as well. Momentum works due to anchoring: the bigger a change, the more likely we are to systematically underestimate it. Remember that time Huffington Post relegated the Trump campaign to the Entertainment section? Ever read headlines about real estate-related equities from Q1 ’07, when subprime had rolled over but the market hadn’t responded?
More cynically, a factor is a risk premium: you get paid a little bit each year in order to pay a lot later. The ostensibly higher returns — the fact that the good years more than offset the bad years — is a function of the fact that during the bad years, everything else is going bad, too, so the losses hurt more than the gains. This is an easy story to tell about momentum and carry, and harder to tell about value. But if you ever look at a value ETF, you’ll see it: the stocks that screen as “value” are the ones that are making money now, but that investors are unwilling to bid up — which is another way of saying that investors think they’ll be hit extra-hard during a recession, and won’t fully participate in a boom.
In fixed-income terms, buying statistically cheap stocks has negative convexity: when times get bad, your exposure grows, but when times get good your exposure shrinks, because the best performers among your value stocks suddenly aren’t value stocks any more.[1] Factor-based value investing is a sort of reflexive, constrained contrarianism — the kind that reliably produces Slate articles and TED talks, but nothing that will actually change anyone’s mind.
Still, factor-based investing can be a good deal for investors. Maybe not a free lunch (unless you’re very clever in how you define your factors), but a food court’s worth of good lunches at a fair prices.
How Factors Go Bad
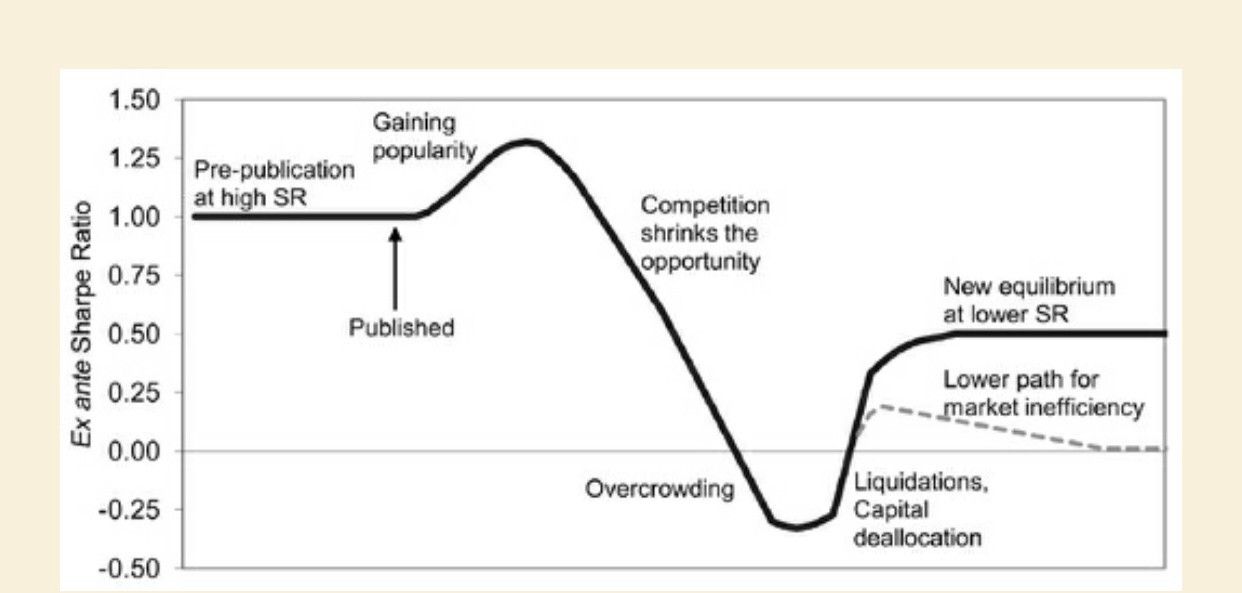
I’ll spare you the Yogi Berra quote, but: when everyone crowds into the same trade, whether the trade is a single asset, an asset class, or a strategy, returns drop afterwards.
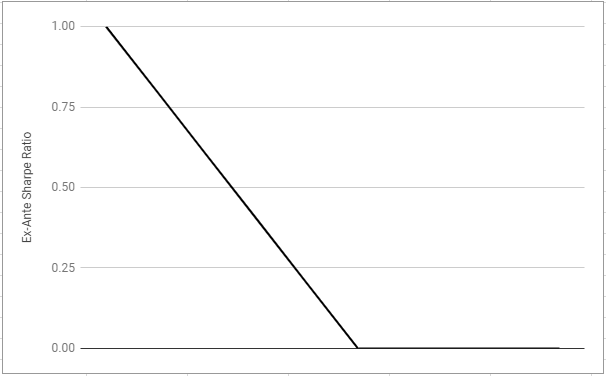
Here’s a stylized chart of how we’d all like to image this process:

And here’s a graph of how it actually goes:

This chart appears in Antti Ilmanen’s Expected Returns, the best finance book I’ve read in years. When I saw this chart, it felt like flipping through a history book and seeing one of my grandparents in the pictures — I drew exactly the same curve a couple years ago during a debate about crowded strategies.
The most important part to note is that while the returns on a crowded trade are bad, the returns on a trade that’s getting crowded are unusually good. As a strategy gets more popular, the practitioners of that strategy become the marginal price-setters, so prices increasingly reflect their version of reality. This chart should scare the pants off of anyone who is having a good year despite increasing competition. “Evacuate? In our moment of triumph?” If you’re playing the odds: yes.
Not shown in the graph is that reality adjusts to gaps between model and reality, typically by creating more of whatever asset is in demand. Public market investors order from the menu, but bankers and CFOs can pass notes back to the kitchen from time to time.
If you were a CFO, what would you do differently in a passives-dominated world? Your goal is to arrange your company’s capital structure so your weighted average cost of capital is as low as possible, which is another way of saying that your business is as valuable as possible. The rise of passive investing causes the market to apply a lower discount rate (i.e. higher valuation) to some kinds of cash flows and not others:
- Since passive investing only applies to public companies, and since really small companies aren’t represented in indices, it means there’s a premium for size — but it’s a step function: going from too small for an index to just big enough produces a bump in passive capital available.
- Since small stocks have outperformed large stocks, factor-based investors have tended to overweight small-cap. The step-function pattern is really a sawtooth, where there’s a bump from joining an index, but a lower premium from being a bigger piece of the index. So if you’re considering reinvesting in your business, consider the fact that you “risk” growing into a more valuation-sensitive investor audience. This means passive tends to create a preference for returning capital over investing it back into a business.
- Passive investors allocate more money to “quality,” where quality is defined as high returns on equity, growth, low volatility, and stable margins. Suppose you’re considering expansion into an adjacent line of business: you think you’ll do well in a year or two, but there will be some margin pressure when you get ramped up, and there’s the risk that your new line of business won’t turn out as well as you think. On the margin, higher passive ownership will make the expected return from this move lower. “Quality” also means that if you’re involved in a business that can be split into a low- and high-quality business (for example, a franchisor and franchisee business), equity markets will apply a lower discount rate to the franchisor than the franchisee. i.e. passive puts a premium on safe intangible assets over messy real-world assets.
If you look at the broad critiques of corporate America’s investing priorities, you see a list that roughly maps to these biases: companies wait longer to go public, but once public they tend to return cash rather than reinvest in the business; and companies seem less adventuresome than they used to be, with a few outlier exceptions. This could just be an example of Americans getting more complacent over time. Or one can synthesize these arguments: Passive investing expresses the demand for complacency, and managers are only too happy to raise the supply of complacency to meet it.
Life on Planet Passive
Here’s a fair criticism of alarmism about passive investing: “You think passive is terrible, it’s worse than Marxism, that it distorts markets to no end. And yet, the vast majority of assets are still actively managed! Passive investors are still only about 15% of the market, so 85% of investors are still reading balance sheets, building discounted cash flow models, and otherwise keeping things in line.”
That’s true, but prices are not determined by the average investor. They’re determined by the marginal investor. In my last piece, I mentioned one example of this: passive funds used to be weighted by market value rather than free float, so they bought a disproportionate share of closely-held companies, which happened to be disproportionately tech. (This point is also borrowed from the interview I mentioned before. Seriously, it’s good! Check it out!) One thing I didn’t mention was a way this fueled the bubble:
By 1998, Yahoo was the beneficiary of a de facto Ponzi scheme. Investors were excited about the Internet. One reason they were excited was Yahoo’s revenue growth. So they invested in new Internet startups. The startups then used the money to buy ads on Yahoo to get traffic. Which caused yet more revenue growth for Yahoo, and further convinced investors the Internet was worth investing in. When I realized this one day, sitting in my cubicle, I jumped up like Archimedes in his bathtub, except instead of “Eureka!” I was shouting “Sell!”
And this was when passive was a low single-digit percentage of the market.
For a fun case study in why we worry about the marginal buyer, let’s turn to Turney Duff (this is from Duff’s memoir, The Buy Side. Buyer beware: it’s not a memoir about trading; it’s a memoir by a guy whose day-job as a trader funded his real passion, which was doing lots of drugs. He’s clean now.)
I begin by identifying our ten largest positions that are illiquid. By illiquid I mean companies that don’t trade more than a few hundred thousand shares a day… At about three o’clock in the afternoon, I get a call from a broker… At 3:30, I call her back and explain how important this year is to me and how I really need her to do a great job. Then I give her the orders with an explicit instruction not to trade them until 3:55. “Not a second before,” I say.
“I know.” She says.
There are ten companies, and I’m shorting each a million shares. I repeat the list of ten stocks back to her. A short of a million shares of XYZ in five minutes, for example, would typically take the stock down at least five dollars, probably more.
I won’t spoil the story, except to say that literally everybody comes out looking bad and somebody comes out a lot richer. But you get the idea: on the margin, a trader who doesn’t care about valuation can push prices out of whack.
While I won’t get into any company-specific details here, I will give you a little scavenger hunt if you want to see this playing out today: consider what happens when a company is fairly boring and slow-growth (so it screens well on quality), is big enough to be part of an index, and is fairly illiquid (so short-sellers are reluctant to take big positions). Illiquidity means that index investors are a larger proportion of the trader base than they are of the owner base, so over time the price-sensitive owners get bought out. If the size of the passive-dollar tidal wave is big enough, this pushes the stock price up — at which point it screens well on momentum, too. Every once in a while, I’ll see some company whose topline is increasing at about the rate of inflation and whose multiple implies it’s a monster growth story. I used to say “Hmmm…” and now I say “Oh! Another one.”
The Passive Factor
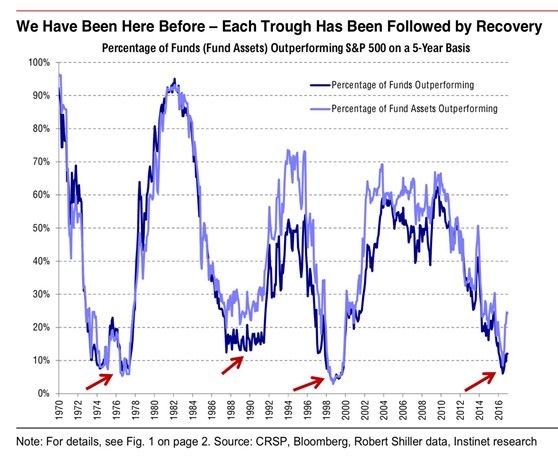
Historically, active returns have moved in cycles, just like everything else in finance:

If you flip the chart upside-down, you have a chart of whether or not going passive is a winning move.
Earlier, we defined a couple factors in terms of the bet that you’re making — momentum is the bet that investors under-discount recent good and bad news, for example, and value is a bet that investors underestimate the power of mean-reversion.
What’s the bet behind passive? It’s simply the bet that the cost of adverse selection (buying something overpriced, or selling something underpriced) is smaller than the cost of active management. Phrased that way, of course it’s going to move in cycles: when passive has had better returns, more assets move to passive; when assets move into passive, the marginal buyer is less sensitive to valuation, so the cost of being wrong about valuation is lower.
But over time, asset mispricings change the behavior of the managers and bankers who supply assets to the market: if the market overpays for something, it’ll get more of it. While passive investing feels like a set-it-and-forget-it move, but conventional choices within a system can be bad choices outside of a system. What if you got a degree in poli sci, and a nice offer for a secure government job — but your degree is from Moscow U. and it’s 1989?
There’s a paradox I’ve been ignoring, here: normally, we’d talk about a factor’s returns relative to some benchmark. But in the case of passive investing, the benchmark is… whatever the passive investor is allocating to! An investment in an equity fund can outperform or underperform the index, but by definition an index fund matches the performance of the index, less fees.
This makes the passive-factor thesis inherently hard to falsify. Suppose passive investors earn broadly subpar returns over the next ten years. They paid for index-level performance, and got what they paid for. You could benchmark them against the “total portfolio,” but that’s hard to measure — and anyway, the biggest non-indexable investment in the Global Portfolio is real estate, which is itself an index fund-like investment — since real estate tracks wages over long periods, an investment in real estate is basically an investment in an index fund of the broader economy.
The closest thing I’ve seen is this piece, which measures whether or not exchange-traded funds (a mostly passive vehicle) increase stock volatility (yes). The paper also notes that a portfolio that is long the stocks in the top decile of index-fund ownership, and short the stocks in the bottom decile, produces excess returns of 56 basis points per month. That’s… a lot, actually. Fidelity’s research shows that valuation metrics like book value and earnings yield produce excess returns of 200–300 bps per year, and momentum is at about 150. The meta-factor of “are factor-based investors overweight this?” blows them out of the water.
What’s Next
For the purpose of this piece, I’m interested in asking questions, not in calls to action. The beauty of factor analysis is that it’s descriptive as well as prescriptive: people were long or short different factors, whether they knew it or not. You can, for example, decompose Warren Buffett’s record into a series of factor bets, although this doesn’t really knock his record: he identified stocks to buy ex ante, and the factors that explained his success are more visible ex post.
However, it’s common for modern portfolio managers to think about their investments in terms of what factor biases they might have, and what sort of correlation or cyclicality that will introduce into their returns. And if the biggest factor of all is one that nobody’s treating as a factor, well, ex post is going to be an interesting time indeed.

