
What Happens When You Buy at an All-Time High?
Smart people's biggest mistakes are always worth understanding, because their mistakes are typically cleverer than the average person's and may give you hints about when you'll talk yourself into doing something too clever for your own good. For example: Benjamin Graham, one of the great investors1, suggested to his protégé Warren Buffett in 1951 that Buffett ought to sit out the market: the Dow had been below 200 every year in history except 1951, so why not wait a while for a better opportunity?
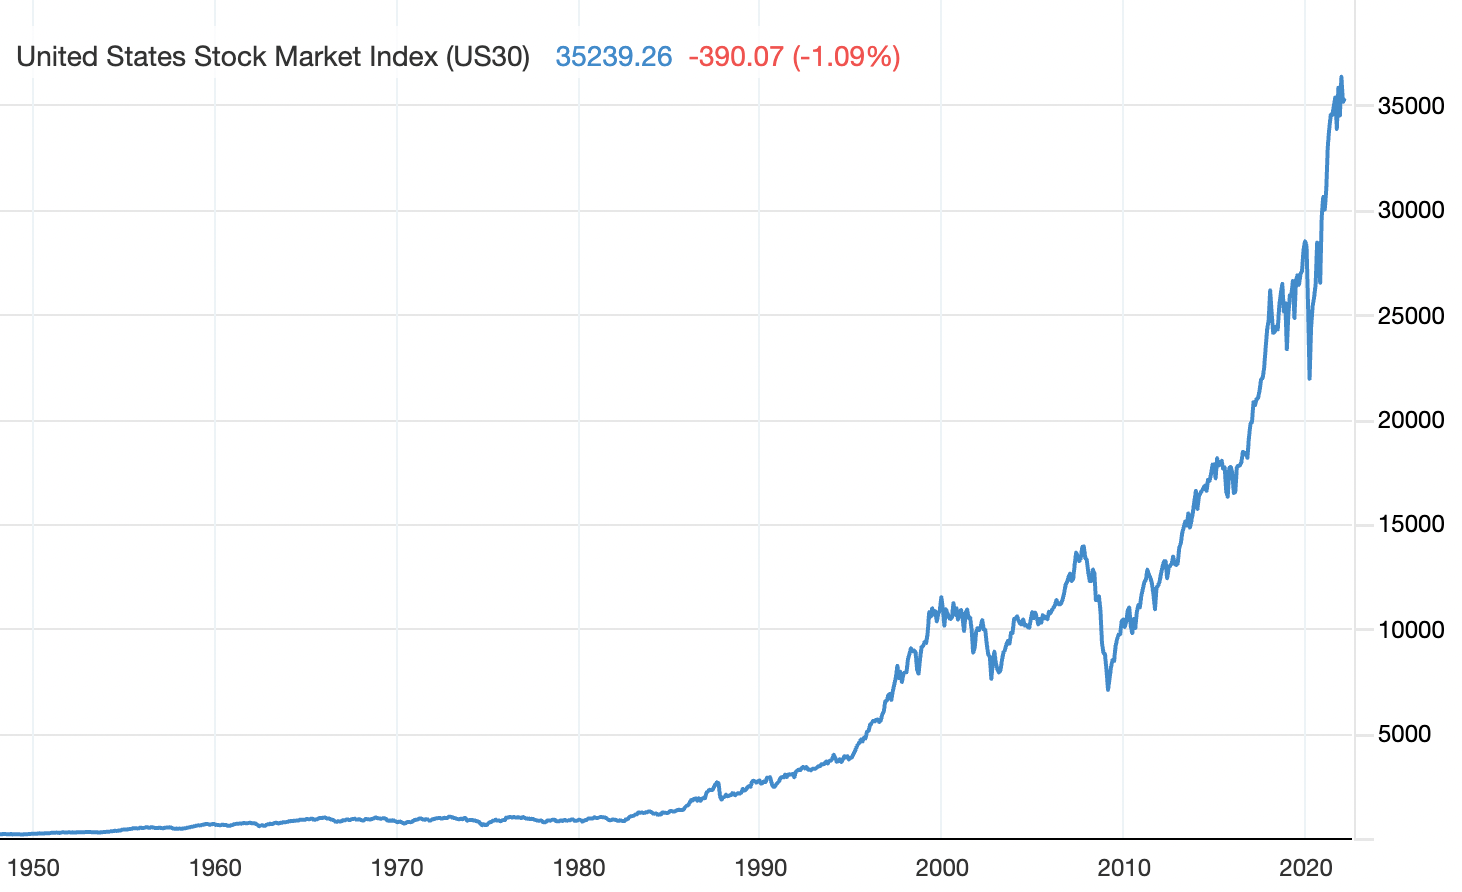
The instinct to shy away from a market after it surpasses a previous bubble record is a healthy one. It's a valuable experience to go through a bear market—the best time to lose 80% or more of your net worth is when you don't have much in the way of savings but also aren't at risk of being unable to pay your bills. But the general tendency of the economy is to grow, so, especially for broad-based indices, record highs are not necessarily something to be afraid of. (In fact, the converse is true: a country like Japan where stock prices are still below record highs is in some ways a scarier place to invest.2) What record highs tend to do is make new participants feel optimistic, since they're officially in a growth industry, while it makes older participants take stock of the situation and think back to the last time they hit that threshold.
What this can mean is that older participants, who have more money and prestige, are a disproportionate influence on prices and behavior around these milestones. When the Dow finally reached its 1929 high, in November of 1954, the generation of investors who started buying stocks only after the war hadn't had enough time to get rich just yet, and didn't have a big impact on the market. Over the next five years, the market's total return was an above-average 14.4% annually; all else being equal, it made sense to buy when there were market participants who had a bad reason not to buy.
This gets into one of the generally fascinating questions about finance: why is it that the momentum factor works? In other words, why is it true on average over time that buying things that have gone up and selling things that have gone down outperforms either buying everything or doing the classic buy low/sell high maneuver? This has been observed in many times and places, going back over a century. It's real, and it's weird. There are two basic schools of thought here:
Momentum benefits from irrational overreaction: when you buy high, you're paying too much, but other people will get unreasonably excited and pay even more. This feels intuitively true, especially in a bull market, but there's a problem with it: if it were universally true, then a) prices would systematically drift further and further from intrinsic value, giving companies a very strong incentive to buy back stock or issue stock to take advantage, and b) all prices would go straight to infinity or zero.3
Momentum benefits from irrational underreaction: investors simply can't bring themselves to believe that good news could be that good (or that durable) or that bad news could be that terminally bad. If you thought Facebook could make money on mobile, or Netflix could make money on streaming, you had a very long time to act on that belief before it was fully reflected in the price. Sometimes this kind of underreaction can be psychological—it's hard to admit that a company's future is determined by a business segment that you mentally wrote off as irrelevant a few quarters ago. And some of it's institutional, when the business is sufficiently different from other things the company does that the wrong person is covering the stock: an analyst who covers Target and Dillards is going to have a hard time modeling the impact of AWS.
There are more recent examples than the 1950s. For example, the Nasdaq Composite took 15 years to get back to its March 2000 high of 5,048. An unlucky tech investor could have spent almost half of their career in a drawdown! But since then, even including the fireworks of the last month, the total return from a Nasdaq 100 ETF has been 19.7% annualized.
We can look more broadly. Indices are not the only place to reach scary all-time highs. US oil production, for example, hit a peak of 9.6m barrels per day in 1970, and dropped by nearly half over the next few decades, reaching a low in 2007. By 2017, though, fracking had brought production back up to that previous record high. If you'd bought oil stocks in November of 2017, when the US finally reached a new all-time high in crude oil production, you would have had uninspiring results: 4.9% compounded, compared to 15.8% for the S&P. Housing starts, too, were a tough one: they reached the 2m annualized rate in November 2003 for the first time since an outlier month in the early 1980s, and stayed near that level for the first time since the 1970s. Unfortunately, homebuilders' share prices took a quick 80% dive starting in 2006, though 2003-5 were certainly good years for them (there isn't a good historical index, but it’s possible to look at individual companies. Lennar returned 34% annualized in that period, MDC did 43%, Pulte hit 50%, and if you'd nailed not only the quantitative direction of the bubble but its qualitatively McMansion-centered nature, Toll Brothers would have made you 60% annualized from 2003 through the summer 2005 peak).
Right now, the IEA expects US oil production to reach all-time records in 2023, while purchase mortgages reached an all-time record last year ($, WSJ). Records are still being set! It's striking that the real-world examples tend to presage oversupply and a cyclical reversal, while the purely financial records often keep getting broken. So it's more evidence for the underreaction theory of momentum: to an investor, it's nerve-wracking to buy at a price above a price that was memorably ruinous. That leads to caution, and caution in markets just means that wealth creation in the present will only get reflected by prices in the future. But in an industry that doesn't have real-time quotes and publicly visible benchmarks, the moment a record is broken is just another busier-than-average day at the office.
Diff Jobs
- A startup in the fintech space improving the process of raising a venture fund is looking for a product manager. (New York, remote)
- A crypto company which is building an open-source wallet is looking for a Head of Growth, with a focus on marketing, and a Smart Contracts Engineer. (US, remote)
- We have a number of Product Design roles across fintech, eCommerce, as well as a Founding Product Design role at a proptech startup that is fractionalising real estate investment. (various)
- A startup expanding financial access is looking for people across product and engineering. (Brazil, NY, US remote)
- There are a number of “Forward-Deployed Engineer”-type roles, where the perfect candidate will combine the interpersonal skills to find out what customers need, and the technical skills to help them integrate a new product with their systems. (various)
- As always, software engineers (every kind) are wanted across multiple sectors. (various)
Elsewhere
Amazon and Ads Ads Ads!
Amazon reported Q4 earnings yesterday, and between the Meta-induced 7.8% price drop during market hours and the 14.2% pop after hours, it gave us all a nice dose of 90s dot-com volatility nostalgia. As had been rumored, Amazon is increasing the price of Prime, and contrary to some expectations, they were able to survive bruising supply chain issues by increasing operating expenses and giving up some revenue growth, both things they'd indicated a quarter ago.
The most interesting detail from the report was that they're finally breaking out advertising, which had always been assumed to be a large share of their "other" revenue, but which is nice to see on its own. Amazon advertising is a $32bn/year business, but it's not like purer ad models such as Facebook or Twitter, where the company creates inventory and then sells ads for external products against it. Amazon's ad business is best thought of as the price-discrimination arm of their regular e-commerce business ($). One noisy and imperfect way to look at this is to compare year-over-year changes in advertising to year-over-year changes in their e-commerce revenue. Amazon disclosed five quarters of ad revenue and five quarters of FX-adjusted growth, so if we ignore FX we get a decent approximation of ad revenue since Q3 2019.4
What you get looks something like this:
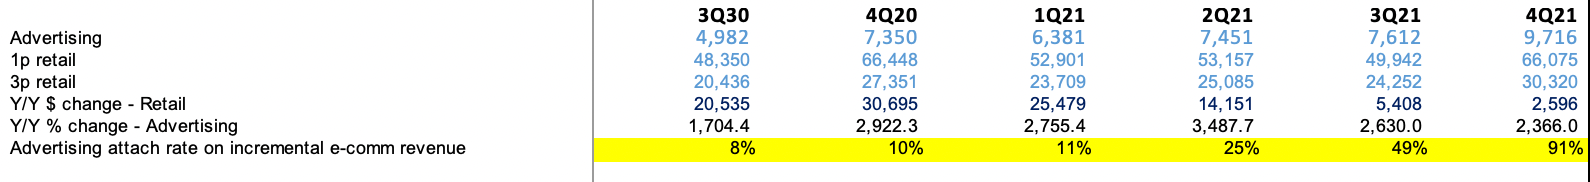
With so few data points, it's important to be cautious about the magnitudes of these numbers; for example, ad growth decelerated in Q2 '20 as advertisers cut budgets everywhere, while online shopping soared. And in Q3 and Q4 of this year, supply chain issues slowed down e-commerce growth relative to trend, making ad growth look relatively better. Meanwhile, shifts in Prime Day also change the mix. But the general pattern seems to be that Amazon captures more of the upside from online shopping in the form of ads rather than e-commerce, and a holistic view of the retail business needs to add all of these together. Over time, as we get more disclosures and as Amazon moves past the unusual one-off features of 2020-21, we’ll get a more consistent view of how e-commerce growth drives ad growth.
Amazon's many interlocked lines of business give it many different ways to drive revenue, but they all amount to either increasing utilization on a fixed-cost investment or driving high-intent eyeballs to ads. As it turns out, a good way to drive growth to a high incremental margin ad business is to invest more in the low-margin business of ultra-fast shipping: the more purchase intent means going straight to Amazon, the more opportunities Amazon has to charge merchants to tweak or redirect that intent to their own products.
Disclosure: I am long AMZN.
NFTs as Tickets
Cameo has been underrated as an interesting company for a while. Yes, it's a way to buy cheesy videos from celebrities, like having a D-list actor wish your friend happy birthday or paying Tiger King's Carol Baskin $399 to pump a stock (the stock's performance since then: -70%). But it's a company that can be compared to dollar stores, which are able to source cheap inventory when supply outstrips demand for inventory-conscious major retailers. Media companies also have to think about their shelf space in a similar way: there are only so many major releases, and only so many minor ones, too, so some famous people end up with enough name recognition to count as famous but not enough to get good gigs.
Cameo recently launched an NFT service, and, oddly enough, it's not the pay-for-adjacency-to-something-famous model that most popular NFTs use. Instead, it's the secondary NFT model, where they represent a ticket that gives the holder access to something exclusive. This is a model that could have broader applications than NFTs as tools of art patronage and signaling, since it offers more composability. You could (if you wanted to) give Cameo NFT holders some extra benefit on a service you operated independently of Cameo. Turning membership into something that's easy to verify and can be used by anyone opens up some price discrimination possibilities, as well as ways for some projects to tap into other projects' network effects. That's a noteworthy template worth paying attention to, even if it starts with a company that helps barely-famous famous people pay their rent.
Wages: Who's Losing?
The Economist highlights higher pay at the bottom of the income distribution ($), among other hiring trends, while Joseph Politano notes that wages for the bottom quintile are rising, especially for hospitality and restaurant workers. One interesting question is: if compensation for the highest earners is, in the aggregate, growing more slowly, but tech companies are paying more ($) as are salaries at investment banks, then who in the top quintile is losing, at least in relative terms? A subset of high-income jobs are doing very well, but high earners in the aggregate are doing relatively less well (though, in an absolute sense, still fine). One candidate for the missing group is what you'd call small business owners (if you like them) and "American gentry" (if you don't): people who own local businesses that sell mostly non-tradable goods, and who broadly benefit from local economic prosperity wherever they are. This class did very well in 2020—the range of businesses they operate overlaps nicely with prime beneficiaries of PPP loans—and may be lapping that windfall this year.
Media-to-Monetization
Financial media companies have an odd sort of "beta": they benefit over time from a rising market, which makes their ad inventory very valuable. But they also benefit from a sharply falling market, which gives them more eyeballs against which they can sell ads. The ideal situation for a financial media company is a generally rising market with some stomach-churning drops to improve clicks. But any media company eventually starts to notice that the better its ad revenues do, the more the winners are the advertisers, rather than the company—the temptation to vertically integrate is hard to ignore. Stocktwits, the investment social network with the rare distinction of surviving, and remaining functional, for over a decade, is incorporating live crypto trading ($, WSJ). One of the minor but still important challenges of financial media companies is that daily habits are a lot more durable than nearly-daily habits, especially if they involve a smartphone that's always being carried around. Since crypto trades nonstop, it's more amenable to constant engagement; there is news flow over the weekend (in fact, since bigger moves are more likely at times of lower liquidity, there's paradoxically more potential newsflow when there's less trading). So this is a virtuous cycle: crypto trading helps them monetize, but it also helps increase the ratio of daily actives to monthly actives, and once someone is in the habit of using a service every single day, they're going to stick around for a while.
Negawatts
Riot Blockchain, a large crypto miner, is shutting down ahead of a winter storm in Texas. I've written before about what happened last year, and what we can learn from it, and it will be interesting to see what we have learned. (The Diff is published from Austin.) Crypto mining has many pluses and minuses, with the plusses being obvious for the recipients of said crypto and the minuses subject to frequent debate. But one subtle plus is that crypto mining creates demand for power but is perfectly capable of shutting down at a moment's notice. (The cost of a shutdown is basically a) damage from equipment that suddenly loses power, and b) the cost of losing power halfway through something and having to start over. An Antminer S-9 operates at 13.5 terahashes per second, and is thus "halfway through" attempting to mine a block 13.5 trillion times each second. It is very safe and non-disruptive to unplug compared to, say, an aluminum smelter.) So for grids that don't price for quite the capacity necessary to handle their peak energy needs, crypto mining is an accidental godsend: a source of demand that can subsidize new supply and be turned off at a moment's notice.
There is some debate over whether or not Graham was one of the best investors ever. His 20-year record from 1936 to 1956 was 20% annualized, compared to 12% for the Dow, which is fine. But it's also worth remembering that Graham survived the 20s without losing his mind and the 30s without losing all of his money, even though available leverage was much higher then. Graham's status as both the father of discretionary value investing (through his fund) and systematic value (through his books) means he gets at least partial credit for investment returns earned by people in both of those intellectual lineages. There are good teachers with bad track records and vice-versa, but Graham is a rare example of someone who outperformed at both. (Another example, also with a value bent, is Julian Robertson; his record as a teacher is easier to measure because so many more of his pupils launched their own funds, meaning there's an easier-to-audit track record.) ↩
I do have some personal investments in Japanese small-cap stocks; I've written before ($) about how Japan is a market that has been cheap for a while and now has some corporate governance catalysts that could make cheap companies better acquisition targets. ↩
Technically sort of true: the median company eventually goes to zero, or at least approaches a negative real return, while a subset of companies are such a large proportion of total market returns that they almost round up to infinity. But in neither case do prices move straight in that direction. ↩
This is only an approximation, and it's a good time to mention that tech stocks still move on FX-driven "surprises" that are not especially surprising to anyone who keeps track of how much companies sell in various non-dollar economies. Somehow over ten years this has remained a semi-reliable way to have an edge in predicting earnings, though it's a hard one for a non-institutional investor to practice; to get it right you need detailed sell-side models, specifically to see how international revenue assumptions change when exchange rates change. Tedious, detail-oriented work. ↩